Result Panel
The Result panel, which is only available after a classifier is trained, provides options to review training results and threshold segmentations, as well as export segmentation results.
Click the Result tab on the Segmentation Trainer dialog to open the Result panel, shown below.
Result panel
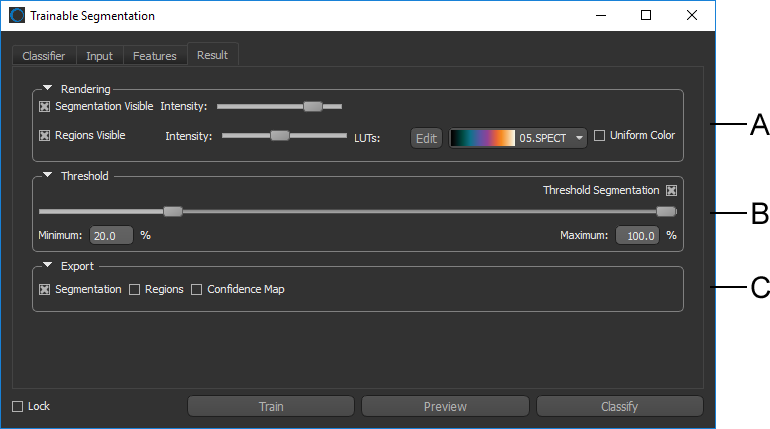
A. Rendering B. Threshold C. Export
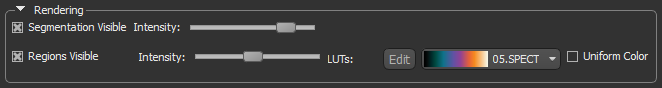
The Rendering options — Segmentation and Regions — can be used to control the way the classification preview results are displayed.
Rendering panel
|
|
Description |
|---|---|
|
Segmentation |
If selected, the segmentation preview will appear in the selected view. You can control the intensity of the segmentation with the slider. |
|
Regions |
If selected, the region computed for region-based training will appear at the selected opacity setting. Additional options for viewing regions include applying a Look-Up Table (LUT) function, which determine how regions are highlighted and how colors are applied. The available LUTs can be edited interactively to optimize displays (see Using the LUT Editor). Whenever a LUT is applied, you can select the Uniform Color option to view the regions in a single color. |
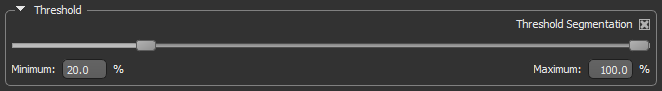
Segmentation results can be thresholded based on a confidence level for the resulting classification on a scale of 0 to 100%. Thresholding can help you to evaluate the effectiveness of a trained classifier.
Threshold options
It is possible to export the segmentation results, computed regions, and the confidence map.
Export options

|
|
Description |
|---|---|
|
Segmentation |
If selected, the segmentation results will be exported to the Data Properties and Settings panel as a series of regions of interest that correspond to the segmentation labels. See ROI Properties and Settings for more information about regions of interest. |
|
Regions |
If selected, the generated regions will be exported to the Data Properties and Settings Panel. |
|
Confidence Map |
If selected, the confidence map will be exported to the Data Properties and Settings Panel. |